


Okay, this is verging off into some pretty wonky stuff, but here are a couple of telling charts from the oddly interesting Portal Seven.
The first is the unemployment rate from 2000 to 2011 showing exactly what damage was done by the Baby Doc Bush Maladministration when it comes to putting people out of work:
Click on either image to view it in a larger format.

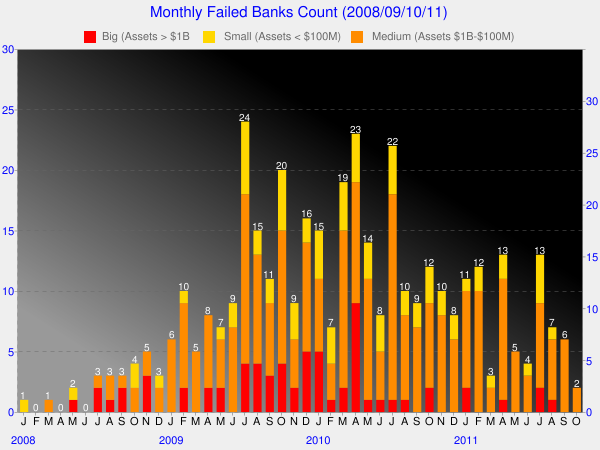
The second is the count of monthly bank failures for the period of 2008 through 2011:
And the War in Afghanistan is now officially in its tenth year of boots-on-the-ground boondoggle, and the generals are saying that they still want the chance to "win" it. Excuse me, but this is where I came in 40 years ago. They wanted the chance to "win" in Vietnam, too, and we all know where that got us.
WASF. Indeed...


1 Comment:
"What are we fighting for? Don't tell me; I don't give a damn - Next stop is Afghanistan"...
Sarge
Indianapolis
Post a Comment